Quick Answer: What Is Forex Technical Analysis?
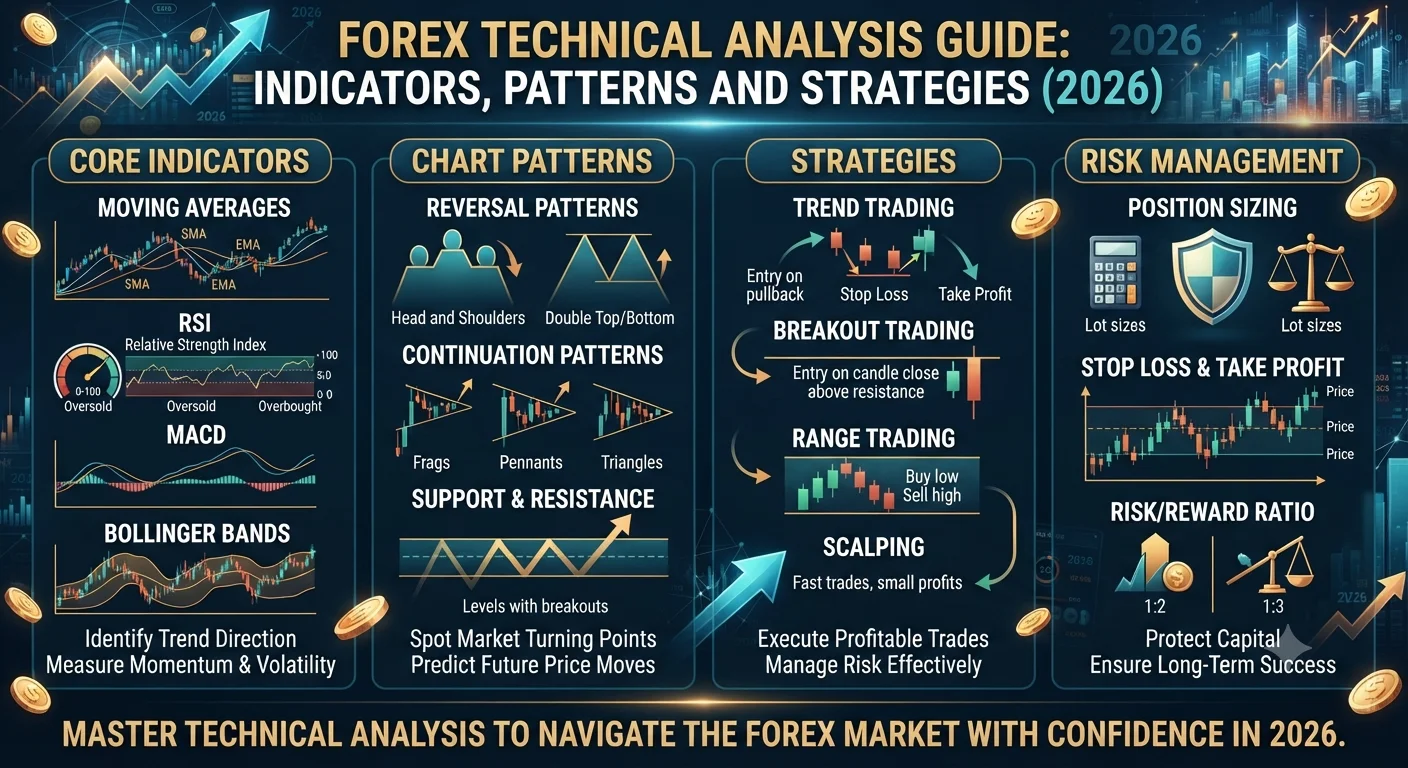
Forex technical analysis is the study of historical price data, primarily through charts, indicators, and pattern recognition, to forecast future currency price movements. It operates on three foundational assumptions: that market prices discount all available information, that prices move in identifiable trends, and that price patterns tend to repeat because human psychology does not change. Technical analysts use this framework to identify high-probability trading opportunities with defined entry points, stop-loss levels, and profit targets.
Introduction
- Quick Answer: What Is Forex Technical Analysis?
- Introduction
- What Is Technical Analysis and How Does It Differ From Fundamental Analysis?
- The 7 Most Powerful Technical Indicators in 2026
- 1. Moving Averages: The Foundation of Trend Identification
- 2. RSI (Relative Strength Index): Measuring Momentum and Extremes
- 3. MACD: Momentum and Trend Direction in One Indicator
- 4. Bollinger Bands: Measuring Volatility and Price Extremes
- 5. Fibonacci Retracement: Natural Market Proportions
- 6. Stochastic Oscillator: Identifying Momentum Shifts
- 7. Average True Range (ATR): The Volatility Measurement Tool
- Classic Chart Patterns Every Trader Must Know
- Head and Shoulders: The Most Reliable Reversal Pattern
- Double Top and Double Bottom: Confirmed Turning Points
- Triangles: Continuation and Breakout Patterns
- Building a Complete Technical Analysis Strategy
- Key Takeaways
- Frequently Asked Questions
Two traders can look at the same EUR/USD chart at the same moment and reach entirely different conclusions about what price will do next. One identifies a bullish engulfing candle at a major support level and sees a buying opportunity. The other sees a downtrending market where every bounce is a selling opportunity. Both are using technical analysis. Neither is necessarily wrong. The difference lies in the time frame they are analyzing, the indicators they weight most heavily, and the framework they use to combine those signals into a trading decision.
Technical analysis is not a crystal ball. No indicator, pattern, or combination of tools predicts the future with certainty. What technical analysis provides is a structured, repeatable process for identifying situations where the historical behavior of price suggests a higher-than-random probability of a specific outcome, combined with clearly defined levels that tell you when that assessment is wrong.
John Murphy, whose textbook "Technical Analysis of the Financial Markets" is the most widely assigned academic reference for the discipline, defines it as "the study of market action, primarily through the use of charts, for the purpose of forecasting future price trends." The methodology has roots in the Dow Theory developed by Charles Dow in the late 19th century, refined through decades of practitioner development, and now applied across every liquid financial market in the world.
This guide covers the seven most important technical indicators, the most reliable classic chart patterns, and a practical framework for combining them into a coherent analytical process in 2026.
What Is Technical Analysis and How Does It Differ From Fundamental Analysis?
Technical analysis and fundamental analysis are the two primary schools of thought in financial market analysis, and understanding their difference clarifies when each is most useful.
Fundamental analysis evaluates an asset's intrinsic value by examining economic data, financial statements, central bank policy, interest rates, and macroeconomic conditions. A fundamental forex analyst studying EUR/USD might analyze the relative economic growth rates of the Eurozone and the United States, compare the interest rate trajectories of the ECB and the Federal Reserve, and assess political risk factors in each region to form a view on whether the euro should be worth more or fewer dollars.
Technical analysis ignores the underlying fundamental factors and focuses exclusively on price behavior itself. Its core premise is that all relevant information, whether publicly known or not, is already reflected in the current market price. The price chart is therefore a complete record of the aggregate judgment of all market participants, and patterns within that record reveal the balance of buying and selling pressure that determines where price will move next.
In practice, the most rigorous market professionals use both. Fundamental analysis identifies which direction to trade a currency pair based on macroeconomic dynamics. Technical analysis identifies the specific entry point, stop-loss level, and target that offers the most favorable risk-to-reward ratio within that fundamental framework. Using them together produces more robust trading decisions than either approach alone.
The 7 Most Powerful Technical Indicators in 2026
Technical indicators are mathematical calculations applied to price data that produce visual overlays on charts or separate panels beneath charts. They help traders identify trends, measure momentum, detect overbought or oversold conditions, and confirm price signals. No single indicator is sufficient alone. The most effective technical setups use two or three complementary indicators that confirm each other rather than piling on redundant tools that all measure the same thing.
1. Moving Averages: The Foundation of Trend Identification
A moving average (MA) calculates the average price of a currency pair over a specified number of periods and plots that average as a continuous line on the chart. As each new period closes, the calculation updates by dropping the oldest period and adding the newest, producing a line that "moves" with price.
Moving averages serve primarily as trend identification tools. When price is consistently above a rising moving average, the trend is bullish. When price is consistently below a falling moving average, the trend is bearish. Moving average crossovers, where a shorter-period MA crosses above or below a longer-period MA, generate widely followed buy and sell signals.
The three most important moving average types are:
The Simple Moving Average (SMA) weights each period equally in its calculation, producing a smooth, stable line that responds slowly to recent price changes. The 50-period and 200-period SMAs on daily charts are the most closely watched moving averages by institutional traders and carry significant self-fulfilling weight as support and resistance levels.
The Exponential Moving Average (EMA) weights recent periods more heavily than older ones, making it more responsive to current price behavior than the SMA. The 20-period EMA on the four-hour chart is widely used by short-term traders as a dynamic support and resistance reference in trending markets.
The 200-Day Moving Average deserves special mention as one of the most universally respected technical levels in all financial markets. When price is above the 200-day SMA on the daily chart, the asset is broadly considered to be in a long-term uptrend. When price is below it, a long-term downtrend is indicated. Institutional fund managers and algorithmic systems reference this level so consistently that it produces significant price reactions when approached.
2. RSI (Relative Strength Index): Measuring Momentum and Extremes
The Relative Strength Index, developed by J. Welles Wilder and published in his 1978 book "New Concepts in Technical Trading Systems," is a momentum oscillator that measures the speed and magnitude of recent price changes to identify overbought and oversold conditions. It is plotted as a line ranging from 0 to 100 in a separate panel below the price chart.
- What Is Leverage in Forex? How It Works, Risks, and Safe Usage (2026)
- How to Read Forex Charts: Candlestick Patterns for Beginners (2026)
- How Does the Foreign Exchange Market Work? Full Structure Explained (2026)
The standard interpretation uses two threshold levels. A reading above 70 indicates that price has risen sharply relative to recent history and the market may be overbought, meaning a correction or consolidation is increasingly likely. A reading below 30 indicates oversold conditions, where a potential bounce or reversal is statistically more likely.
The most powerful RSI signals are not the simple overbought and oversold readings but RSI divergence: a condition where price makes a new high but RSI fails to make a corresponding new high (bearish divergence), or where price makes a new low but RSI fails to make a corresponding new low (bullish divergence). These divergences signal weakening momentum beneath the surface of the price trend and frequently precede significant reversals.
RSI works most reliably in ranging markets where price moves between defined support and resistance levels. In strongly trending markets, RSI can remain in overbought or oversold territory for extended periods without producing a meaningful reversal, which is a limitation all traders must understand before using it.
3. MACD: Momentum and Trend Direction in One Indicator
The Moving Average Convergence Divergence (MACD), developed by Gerald Appel in the late 1970s, is one of the most widely used technical indicators across all financial markets. It measures the relationship between two exponential moving averages and displays the result as a momentum indicator that reveals both trend direction and momentum strength.
The standard MACD configuration uses three components: the MACD line (the difference between the 12-period EMA and the 26-period EMA), the signal line (a 9-period EMA of the MACD line), and the histogram (the visual representation of the difference between the MACD line and the signal line).
The primary trading signals generated by MACD are:
Signal line crossovers: When the MACD line crosses above the signal line, it generates a bullish signal. When it crosses below, it generates a bearish signal. These crossovers work best when confirmed by the crossover occurring below the zero line (for bullish signals) or above it (for bearish signals).
Zero line crossovers: When the MACD line crosses above zero, it indicates that the short-term average has overtaken the long-term average, confirming a shift to bullish momentum. A cross below zero confirms bearish momentum.
MACD divergence: Like RSI divergence, when price makes a new high but MACD makes a lower high, the divergence signals weakening bullish momentum. This is one of the most reliable reversal warning signals available to technical traders.
4. Bollinger Bands: Measuring Volatility and Price Extremes
Bollinger Bands, developed by technical analyst John Bollinger in the 1980s, consist of three lines plotted on the price chart: a middle band (typically a 20-period SMA), an upper band set two standard deviations above the middle band, and a lower band set two standard deviations below it. Because standard deviation is a measure of volatility, the bands expand when volatility is high and contract when volatility is low.
The statistical foundation is that approximately 95 percent of all price action should fall within the two standard deviation bands under normal distribution assumptions. Price touching the upper band does not constitute a sell signal on its own, but it indicates that price is at a statistically unusual high relative to recent volatility. In trending markets, price can "walk" along the upper or lower band for extended periods. In ranging markets, touches of the bands are more reliable reversal indicators.
The Bollinger Band Squeeze is the setup that many traders find most useful. When the bands contract to an unusually narrow width, it indicates a period of very low volatility that historically precedes a significant directional breakout. The direction of the breakout cannot be predicted from the squeeze itself, but the squeeze warns that a large move is likely imminent and that being positioned for the breakout in either direction is a high-value opportunity.
5. Fibonacci Retracement: Natural Market Proportions
Fibonacci retracement levels are horizontal lines drawn on a price chart at specific percentages of a prior price move: 23.6 percent, 38.2 percent, 50 percent, 61.8 percent, and 78.6 percent. These levels are derived from the Fibonacci sequence, a mathematical series identified by the medieval Italian mathematician Leonardo Fibonacci in which each number is the sum of the two preceding numbers (0, 1, 1, 2, 3, 5, 8, 13, 21...).
The specific ratios used in financial technical analysis, particularly 61.8 percent (known as the Golden Ratio), appear with remarkable frequency in natural phenomena and have been observed to correspond to areas of price support and resistance in financial markets, though the causal mechanism for this remains debated among academics.
Recommended Articles
 FOREX TRADING BASICS
 FOREX TRADING BASICS
 FOREX TRADING BASICS
 FOREX TRADING BASICS
In practice, traders draw Fibonacci retracement levels by identifying a significant high and low on a chart and applying the tool between those two extremes. After a strong upward move, price frequently retraces to one of the Fibonacci levels before the trend resumes. The 61.8 percent retracement, often called "the golden retracement," is the most closely watched and most frequently respected of these levels in forex markets.
Fibonacci levels are most powerful when they coincide with other technical factors: a prior horizontal support or resistance level, a moving average, or a significant candlestick pattern forming at the Fibonacci level. Confluence of multiple technical factors at the same price level significantly increases the reliability of any signal generated there.
6. Stochastic Oscillator: Identifying Momentum Shifts
The Stochastic Oscillator, developed by George Lane in the 1950s, compares a currency pair's closing price to its price range over a specified period. It produces two lines, the percent K line and the percent D line (a smoothed moving average of percent K), plotted between 0 and 100.
Like RSI, readings above 80 are considered overbought and readings below 20 are considered oversold. The primary trading signal is the crossover of the percent K line above or below the percent D line, particularly when this crossover occurs within the overbought or oversold zones.
The Stochastic is most effective on shorter time frames and in ranging market conditions. Many traders use it in combination with RSI: when both indicators simultaneously show oversold readings and begin turning upward from below 20 and 30 respectively, the confluence produces a higher-probability reversal signal than either indicator alone.
7. Average True Range (ATR): The Volatility Measurement Tool
The Average True Range, also developed by J. Welles Wilder in 1978, measures market volatility by calculating the average of the true range over a specified number of periods. The true range accounts for price gaps between sessions and is therefore more accurate than simple high-minus-low calculations.
ATR does not generate directional buy or sell signals. Its primary uses in a technical trading framework are stop-loss placement (as discussed in the risk management article), position sizing calibration (wider ATR means higher volatility and therefore smaller position sizes to maintain consistent dollar risk), and identifying breakout conditions (a price move that exceeds a multiple of the ATR is more significant than one that does not).
Classic Chart Patterns Every Trader Must Know
Beyond individual indicators, certain recurring price formations, known as chart patterns, provide structured trade setups with defined entry, stop-loss, and target parameters. The most reliable patterns are those that have been documented across multiple markets and time frames over decades of observation.
Head and Shoulders: The Most Reliable Reversal Pattern
The Head and Shoulders pattern is widely considered the most reliable bearish reversal formation in technical analysis. It consists of three peaks: a left shoulder (first peak), a head (higher central peak), and a right shoulder (third peak roughly equal in height to the left shoulder). The three peaks are connected at their base by a line called the neckline.
The pattern is completed and the trade is signaled when price breaks below the neckline following the right shoulder's formation. The price target is measured by taking the height from the neckline to the head and projecting that same distance below the neckline breakout point. The stop-loss for a short trade is placed above the right shoulder.
The Inverse Head and Shoulders is the bullish mirror image, appearing after a downtrend and signaling a potential reversal to the upside with the same measurement methodology applied upward.
Double Top and Double Bottom: Confirmed Turning Points
A Double Top is a bearish reversal pattern formed when price makes two consecutive highs at approximately the same level, separated by a moderate pullback. The two highs represent two failed attempts to break above a resistance level, signaling that sellers are consistently overwhelming buyers at that price. Confirmation occurs when price breaks below the low of the pullback between the two highs.
A Double Bottom is the bullish equivalent: two lows at approximately the same level with a rally between them, confirming that buyers are defending the support level consistently. Confirmation occurs on a break above the high of the rally between the two lows.
Both patterns are high-reliability formations because they require multiple tests of the same level before triggering, which filters out single-bar false signals and provides a clear, objective confirmation point that removes ambiguity from the entry decision.
Triangles: Continuation and Breakout Patterns
Triangle patterns represent periods of consolidation within or between trends, characterized by converging trend lines that create a geometric triangle shape on the chart. Three primary triangle types appear in forex markets:
An Ascending Triangle has a horizontal resistance line at the top and a rising support line at the bottom, creating a pattern where higher lows compress price against flat resistance. This formation indicates accumulating buying pressure and typically resolves with an upward breakout through the resistance.
A Descending Triangle has a horizontal support line at the bottom and a falling resistance line at the top. Lower highs compress price against flat support, indicating building selling pressure and typically resolving with a downward breakdown through the support.
A Symmetrical Triangle has both a descending resistance line and a rising support line converging toward a point. It indicates balanced indecision between buyers and sellers and can resolve in either direction. Traders watch for the breakout direction to determine the trade setup.
Building a Complete Technical Analysis Strategy
Understanding individual indicators and patterns is the beginning. Building a complete, functional technical analysis strategy requires combining them into a coherent analytical process that produces consistently objective trading decisions.
A practical three-layer framework used by many professional technical traders works as follows:
Layer one: Trend identification. Using the daily chart, determine the dominant trend direction using the 50-period and 200-period moving averages and overall price structure. Only take trades in the direction of the dominant trend on shorter time frames. Trading against the trend with purely technical setups dramatically reduces the probability of success.
Layer two: Structure identification. On the four-hour chart, identify the key support and resistance levels where price has previously reversed, consolidated, or accelerated. These are the locations where your setups will be most meaningful. Mark them clearly before the trading session begins.
Layer three: Trigger signal. On the one-hour or 15-minute chart, wait for a specific candlestick pattern or indicator signal at one of the levels identified in layer two that confirms the direction established in layer one. The combination of the higher time frame trend, the structural level, and the trigger signal creates the "three-dimensional" setup that experienced traders find most reliable.
Enter only when all three layers align. Set the stop-loss below the structural level at which the trigger appeared. Set the take-profit at the next significant level identified in layer two. Calculate the risk-to-reward ratio before entry. If it does not meet your minimum threshold, do not take the trade regardless of how attractive the setup looks.
Key Takeaways
- Technical analysis is the study of historical price data through charts, indicators, and patterns to identify high-probability trading opportunities with defined risk parameters.
- The seven most powerful indicators are moving averages (trend), RSI (momentum and overbought/oversold conditions), MACD (trend direction and momentum shifts), Bollinger Bands (volatility and extremes), Fibonacci retracement (natural support and resistance ratios), Stochastic Oscillator (short-term momentum), and ATR (volatility measurement for stops and sizing).
- Classic chart patterns including Head and Shoulders, Double Tops and Bottoms, and Triangles provide structured trade setups with objective entry, stop, and target parameters derived from the pattern itself.
- No single indicator or pattern works in isolation. The most reliable setups occur when multiple technical factors, higher time frame trend, structural levels, and trigger signals, align simultaneously at the same price level.
- Technical analysis works most effectively when combined with fundamental analysis: using macro analysis to determine the directional bias and technical analysis to optimize entry timing and risk management.
Frequently Asked Questions
How many indicators should I use on my charts? Two to three complementary indicators is the professional standard. More than this creates visual noise and conflicting signals that impair decision-making rather than improving it. A useful combination pairs a trend indicator (moving average), a momentum indicator (RSI or MACD), and a volatility measurement tool (ATR or Bollinger Bands). Each component provides different information that genuinely adds to the analytical picture without redundancy.
What is the most accurate technical indicator for forex? No single indicator is consistently the most accurate across all market conditions, currency pairs, and time frames. RSI divergence and MACD crossovers at key market structure levels have among the strongest documented track records in research literature, but their reliability depends heavily on the market environment and the quality of the broader setup. The most reliable signals always combine multiple confirming factors rather than depending on any single indicator.
Does technical analysis work for all currency pairs? Technical analysis works best in liquid markets where a large number of participants are actively trading. Major currency pairs like EUR/USD, GBP/USD, and USD/JPY produce the cleanest technical setups because their high liquidity means price behavior reflects genuine supply and demand dynamics rather than the thin-market distortions that make technical analysis less reliable in exotic pairs. Exotic pairs with low liquidity can produce false breakouts and erratic price behavior that technical indicators struggle to interpret meaningfully.
What time frame is best for technical analysis in forex? The most appropriate time frame depends on your trading style. Day traders primarily use five-minute to one-hour charts for execution, with four-hour charts for context. Swing traders use four-hour and daily charts for setup identification with weekly charts for trend context. Long-term position traders use weekly and monthly charts. Most professional technical analysts use multiple time frames in combination: identifying the trend on a higher time frame and finding entries on a lower time frame within that trend's direction.
Can technical analysis predict news-driven price movements? Technical analysis cannot predict the content or direction of unexpected news events. However, it can provide important context for how markets respond to news. Price that was already approaching a major technical resistance level before a news event may react more violently to a bearish surprise than price in the middle of a range. Experienced traders use technical levels to identify where post-news price action is likely to pause, reverse, or accelerate, even when the news itself was unpredictable.
Is technical analysis self-fulfilling? Partly, and deliberately so. When a large majority of market participants watch the same levels, for example the 200-day moving average or a well-known Fibonacci level, their collective decisions to buy, sell, or place orders near those levels make the levels more likely to produce meaningful price reactions. This self-fulfilling element does not invalidate technical analysis. It is one of the mechanisms by which certain levels and patterns acquire their predictive power in markets driven by the collective decisions of human participants.
RISK DISCLAIMER: Technical analysis is a tool for identifying probabilistic trading opportunities and does not guarantee profitable outcomes. Forex trading involves substantial risk of loss. This article is for educational purposes only and does not constitute financial advice.