Quick Answer: What Are the Most Important Economic Indicators for Forex Traders?
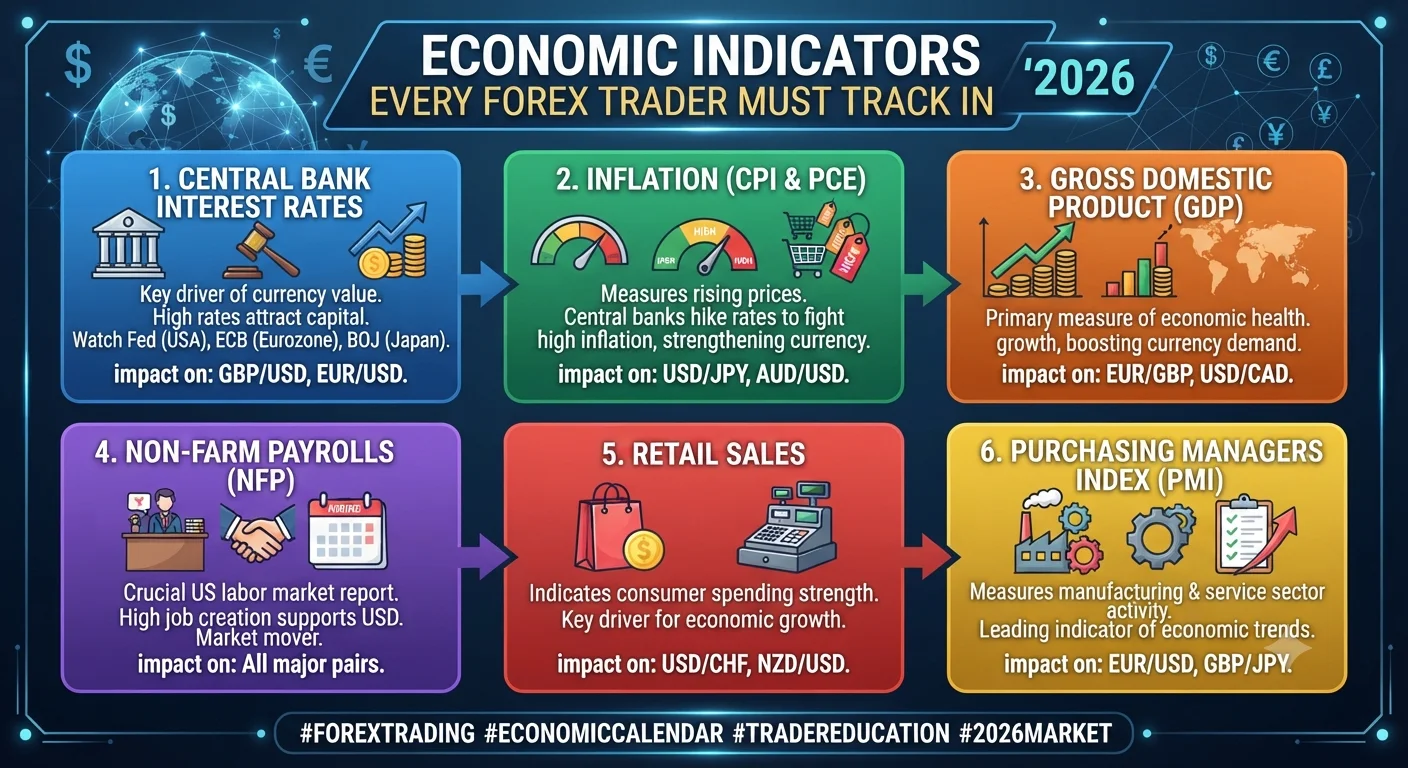
The ten most important economic indicators for forex traders are Non-Farm Payrolls (NFP), the Consumer Price Index (CPI), Gross Domestic Product (GDP), central bank interest rate decisions, the Purchasing Managers Index (PMI), retail sales data, the trade balance report, the unemployment rate, the Producer Price Index (PPI), and the Consumer Confidence Index. These indicators move currency markets because they reveal the economic health, inflation dynamics, and monetary policy direction of the countries whose currencies traders buy and sell.
Introduction
- Quick Answer: What Are the Most Important Economic Indicators for Forex Traders?
- Introduction
- What Are Economic Indicators and Why Do They Move Forex Markets?
- The 10 Most Important Economic Indicators in 2026
- 1. Non-Farm Payrolls (NFP): The King of Economic Data
- 2. Consumer Price Index (CPI): Inflation and Currency Value
- 3. GDP Reports: Measuring Economic Growth
- 4. Central Bank Interest Rate Decisions
- 5. Purchasing Managers Index (PMI)
- 6. Retail Sales Data
- 7. Trade Balance Reports
- 8. Unemployment Rate
- 9. Producer Price Index (PPI)
- 10. Consumer Confidence Index
- How to Use an Economic Calendar in Your Trading Strategy
- Key Takeaways
- Frequently Asked Questions
Every day, governments and statistical agencies around the world release data measuring the performance of their economies. For most people, these reports are abstract numbers reported briefly on the evening news. For forex traders, they are the raw material from which currency price movements are made.
The relationship between economic data and currency prices is not arbitrary. Currency values reflect the economic health and monetary policy outlook of the countries they represent. A strong jobs report in the United States signals a healthy economy, which supports Federal Reserve confidence in maintaining or raising interest rates, which increases the attractiveness of holding US dollars, which drives the dollar higher against other currencies. This chain of cause and effect plays out continuously across global markets in response to the regular stream of economic data releases.
Understanding the ten most important economic indicators, what they measure, why they matter to currency markets, and how to prepare your trading for their release is essential knowledge for any trader who wants to avoid being blindsided by major market movements.
What Are Economic Indicators and Why Do They Move Forex Markets?
Economic indicators are statistical measurements that describe the current or projected state of an economy. They are typically produced by government statistical agencies (such as the US Bureau of Labor Statistics, the Office for National Statistics in the UK, or Eurostat for the European Union), central banks, or research organizations.
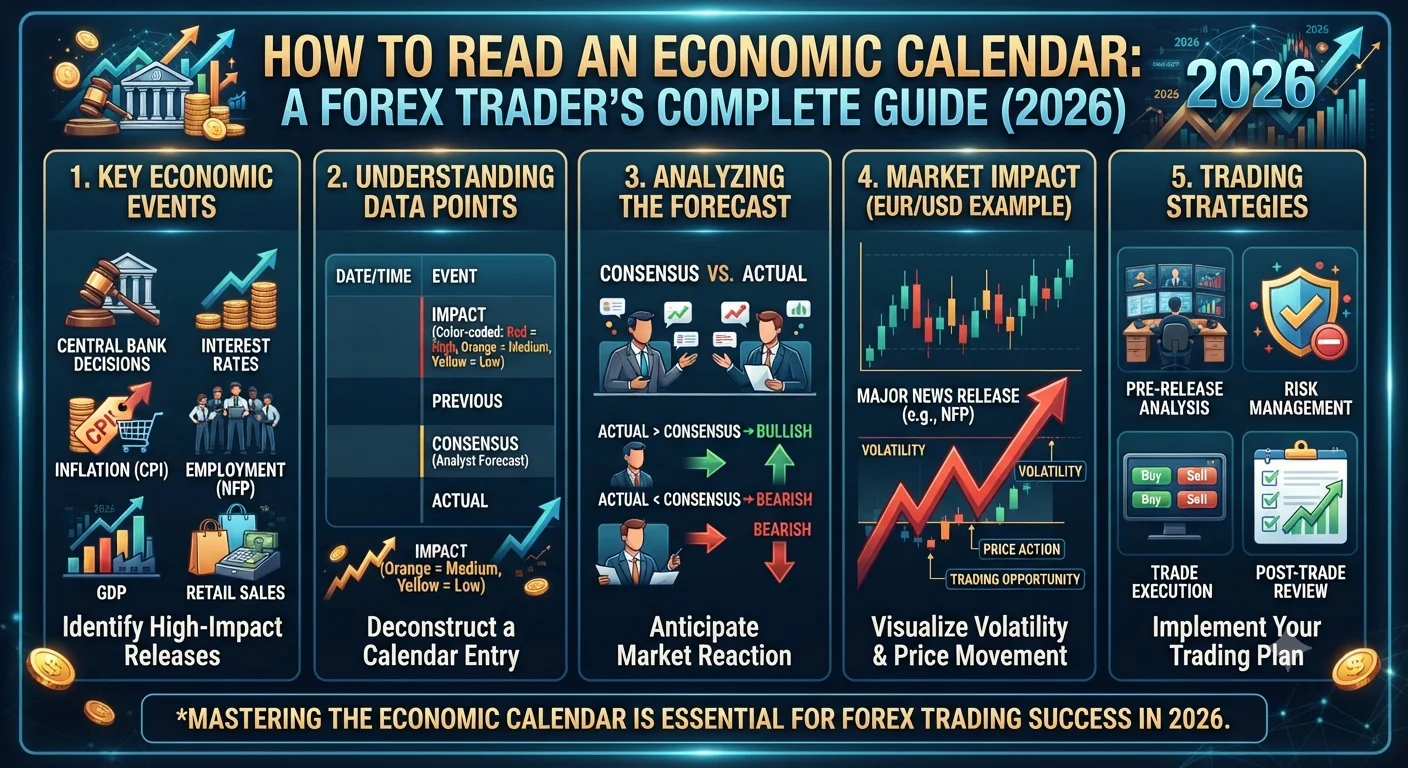
Markets move on economic data because of the concept of expectations versus reality. Before each major data release, financial analysts and economists survey their peers to produce a consensus estimate: the average expectation for what the number will show. This consensus is published in advance through economic calendar services.
When the actual released figure matches the consensus closely, markets often react minimally because the expected outcome was already priced in. When the actual figure significantly beats the consensus (a positive surprise), markets typically react sharply in the direction that reflects the stronger reading. When the figure significantly misses the consensus (a negative surprise), the opposite reaction occurs. This is why experienced traders say that "trading the data" is really about trading the deviation from expectations, not the absolute level of the number itself.
Central bank reaction is the critical transmission mechanism. Economic data shapes the expectations markets form about what central banks will do next with interest rates. Since interest rate differentials are the primary long-term driver of currency values, data that changes rate expectations has immediate and powerful effects on currency prices.
The 10 Most Important Economic Indicators in 2026
1. Non-Farm Payrolls (NFP): The King of Economic Data
Non-Farm Payrolls is released on the first Friday of every month by the US Bureau of Labor Statistics. It measures the net change in the number of employed people in the United States during the previous month, excluding agricultural workers, government employees, private household employees, and employees of nonprofit organizations (hence "non-farm").
NFP is widely considered the single most market-moving scheduled economic data release in the world. The report typically causes the largest intraday price spikes in USD-denominated currency pairs, often producing movements of 50 to 150 pips or more within the first hour of release in pairs like EUR/USD and GBP/USD.
Why does one employment report carry this weight? Because the Federal Reserve has a dual mandate: to maintain price stability (control inflation) and to achieve maximum employment. Employment data is therefore directly relevant to Fed monetary policy decisions. A stronger-than-expected NFP print suggests the labor market is tight, which may encourage the Fed to maintain or raise rates, which strengthens the USD. A weaker-than-expected print raises questions about economic health and the potential need for rate cuts, which typically weakens the USD.
NFP releases are accompanied by the unemployment rate and average hourly earnings data, both of which markets scrutinize alongside the headline payroll figure. A large NFP beat accompanied by rising average hourly earnings (signaling wage inflation) sends an especially strong bullish signal for the USD.
2. Consumer Price Index (CPI): Inflation and Currency Value
The Consumer Price Index measures the average change in prices paid by urban consumers for a basket of goods and services over time. It is the most widely followed measure of inflation in most developed economies. In the United States, CPI is published monthly by the Bureau of Labor Statistics. The Eurozone equivalent is the Harmonised Index of Consumer Prices (HICP), published by Eurostat.
Inflation is the primary mandate of most central banks. The Federal Reserve, European Central Bank, Bank of England, and Bank of Japan all target specific inflation rates (typically around 2 percent annually) and adjust interest rates primarily to maintain inflation near that target. CPI data therefore has a direct and immediate influence on market expectations for central bank policy.
When CPI comes in above expectations, markets immediately price in a higher probability of interest rate increases, which strengthens the currency. When CPI falls below expectations, rate cut expectations increase, which weakens the currency. The Core CPI figure, which strips out volatile food and energy prices, is typically given more weight by central banks and analysts because it provides a cleaner signal of underlying inflation trends.
The Bank for International Settlements has extensively documented the relationship between inflation expectations, central bank credibility, and currency stability, confirming that inflation dynamics remain the central driver of long-term exchange rate movements.
3. GDP Reports: Measuring Economic Growth
Gross Domestic Product measures the total monetary value of all goods and services produced within a country's borders in a given period. It is the broadest single measure of economic activity and health. GDP figures are typically published quarterly in major economies, with an initial "advance" estimate released approximately one month after the quarter ends, followed by revised estimates as more complete data becomes available.
Strong GDP growth signals that businesses are producing more, employment is generally healthy, and consumer spending is robust. This environment supports corporate profitability and gives central banks confidence to maintain or tighten monetary policy, both of which support the currency. Contracting GDP (negative growth for two consecutive quarters meets the technical definition of a recession) typically leads to currency weakness as markets anticipate monetary easing.
The GDP growth rate that markets focus on is the annualized rate of change: by how much is the economy growing or contracting on an annualized basis compared to the previous period? In the United States, this figure is published by the Bureau of Economic Analysis (BEA). The European equivalent comes from Eurostat. The UK Office for National Statistics publishes UK GDP data.
4. Central Bank Interest Rate Decisions
Central bank interest rate decisions are not monthly statistical releases in the same sense as NFP or CPI, but they are the single most powerful scheduled events in the forex calendar. Eight times per year (for the Federal Reserve's FOMC meetings, the ECB's Governing Council meetings, and the Bank of England's Monetary Policy Committee meetings), the world's major central banks announce whether they are raising, cutting, or holding interest rates.
The rate decision itself often produces limited market movement if it matches expectations, because sophisticated markets price in expected decisions well in advance based on preceding economic data and central bank communication. What generates the largest movements is the accompanying statement and press conference, where central bank governors provide forward guidance about their assessment of economic conditions and the likely path of future rate decisions.
The Federal Reserve Chair's press conference following each FOMC decision is among the most closely watched events in global financial markets. A single phrase change in the statement, suggesting that the Fed is more or less hawkish (inclined toward rate hikes) or dovish (inclined toward rate cuts) than previously, can produce currency movements of 100 pips or more.
Traders track interest rate probability tools published by major exchanges, such as the CME Group's FedWatch Tool, which displays market-implied probabilities for each possible rate outcome at upcoming Fed meetings. These probabilities shift continuously as new economic data is released and provide a real-time gauge of how markets are interpreting the monetary policy outlook.
5. Purchasing Managers Index (PMI)
The Purchasing Managers Index surveys purchasing managers at private sector companies about whether key business conditions (new orders, employment, production, supplier deliveries, and inventory levels) are improving, deteriorating, or unchanged compared to the previous month. It is published monthly by S&P Global (formerly IHS Markit) for most major economies.
The PMI is structured as a diffusion index: a reading above 50 indicates that the measured conditions are expanding on balance. A reading below 50 indicates contraction. The further from 50 in either direction, the stronger the expansion or contraction signal.
Two headline PMI figures receive particular attention: the Manufacturing PMI, which measures the industrial production sector, and the Services PMI, which reflects the generally larger service sector of developed economies. The Composite PMI combines both into a single overall reading.
Recommended Articles
 ECONOMIC NEWS ANALYSIS
PMI data is particularly valuable because it is released before most other economic data for the same month, giving traders an early glimpse into the current economic trajectory. A sharp decline in PMI, particularly for services in a services-dominant economy, can meaningfully shift expectations for GDP growth and central bank policy.
6. Retail Sales Data
Retail sales measures the total value of consumer purchases at retail establishments, serving as a proxy for consumer spending activity. Since consumer spending accounts for approximately 70 percent of GDP in the United States (according to Bureau of Economic Analysis data) and a similarly large proportion in other developed economies, retail sales data provides a direct gauge of economic momentum.
Strong retail sales data signals healthy consumer confidence and spending, which supports GDP growth and corporate revenues. Weak retail sales suggests consumers are pulling back, which may presage broader economic slowing. The core retail sales figure, which excludes automobile purchases due to their lumpy, infrequent nature, provides a cleaner read on underlying consumer spending trends.
7. Trade Balance Reports
The trade balance measures the difference between a country's total exports and total imports over a given period. A trade surplus (exports exceeding imports) generally supports currency demand because foreign buyers must purchase the domestic currency to pay for exported goods. A trade deficit (imports exceeding exports) creates the opposite dynamic: domestic buyers must sell their currency to purchase foreign goods.
The trade balance is most market-moving in economies where trade flows represent a larger share of GDP, such as export-dependent economies like Germany, Japan, and China. For the United States, whose domestic economy is less trade-dependent relative to its size, the trade balance is somewhat less market-moving than other indicators, though it still garners significant attention when the figures deviate sharply from expectations.
8. Unemployment Rate
The unemployment rate measures the percentage of the labor force that is actively seeking employment but unable to find it. It is typically released alongside the Non-Farm Payrolls report in the United States and is published monthly by statistical agencies in most developed economies.
The unemployment rate provides complementary context to the employment change figures. A falling unemployment rate with strong job creation suggests genuine labor market strengthening. A falling unemployment rate accompanied by weak job creation may reflect labor force shrinkage (people stopping their job search) rather than genuine improvement, which is a less bullish signal.
For central banks, the unemployment rate is a direct input into monetary policy decisions, as it reflects progress toward the "maximum employment" component of their mandates. The Federal Reserve publishes detailed labor market assessments in its Summary of Economic Projections, which includes unemployment rate forecasts and is released four times per year.
9. Producer Price Index (PPI)
The Producer Price Index measures the average change in prices received by domestic producers for their goods and services at the wholesale or producer level. It is essentially a measure of inflation at the production stage, before goods reach consumers.
PPI matters to forex traders because it is a leading indicator of future consumer price inflation. When producers face rising input costs, they typically pass those costs forward to retailers and ultimately to consumers, which eventually shows up in CPI. A sharp rise in PPI therefore signals potential future CPI increases, which can shift market expectations for central bank tightening even before the CPI data reflects the trend.
The Core PPI, which excludes food and energy just as Core CPI does, is the more analytically useful figure for assessing underlying inflationary pressure in the production pipeline.
10. Consumer Confidence Index
Consumer confidence surveys measure how optimistic or pessimistic consumers are about their current financial situation and future economic prospects. Two widely followed confidence measures in the United States are the Conference Board Consumer Confidence Index (released monthly) and the University of Michigan Consumer Sentiment Index (released preliminary and final each month).
High consumer confidence is associated with greater willingness to spend, borrow, and invest, which supports economic growth. Low confidence signals potential pullback in consumer spending, which can dampen GDP growth and corporate earnings. For currency markets, consumer confidence data serves as an early warning signal for shifts in economic momentum, particularly when it diverges sharply from other economic indicators.
How to Use an Economic Calendar in Your Trading Strategy
An economic calendar is a schedule of upcoming data releases and events, showing the date, time, expected impact level (low, medium, or high), the consensus forecast, the previous figure, and the actual result once released. Most brokers provide an integrated economic calendar, and several independent providers (including Investing.com, Forexfactory.com, and the official websites of statistical agencies) publish comprehensive calendars freely.
An effective approach to integrating the economic calendar into your trading involves three phases:
Pre-release preparation: At the start of each trading week, review all high-impact scheduled events. Note the exact release times, the relevant currency pairs that will be most affected, the current consensus estimates, and any recent trend in whether the actual figures have been beating or missing estimates.
During the release: Avoid having open positions in the affected currency pairs immediately before and during major data releases unless you are specifically trading the news. The spreads in affected pairs often widen dramatically in the minutes around major releases as liquidity temporarily dries up, making stop-losses more likely to be triggered at unfavorable prices.
Post-release analysis: After the dust settles (typically 15 to 30 minutes after the release), analyze the price reaction. Did it align with the direction the deviation from expectations would predict? If not, this "divergence from expected reaction" is itself a significant signal that the market may be pricing in additional factors not captured in the headline figure.
Key Takeaways
- Economic indicators move forex markets because they shape expectations for central bank monetary policy, which drives interest rate differentials, which are the primary long-term determinant of currency values.
- Markets trade the deviation from consensus expectations, not the absolute level of the figure. A strong number that merely meets expectations may produce no movement, while a number that significantly beats or misses expectations can trigger major price swings.
- Non-Farm Payrolls, CPI, GDP, and central bank rate decisions are the highest-impact scheduled events in the forex calendar and deserve special attention from every forex trader.
- An economic calendar is an essential tool that should be reviewed at the start of every trading week to identify upcoming high-impact releases and plan position management accordingly.
- Core figures (Core CPI, Core PPI, Core Retail Sales) strip out volatile components and provide a cleaner signal of underlying trends that central banks focus on when making policy decisions.
Frequently Asked Questions
Where can I find a reliable economic calendar? Reliable economic calendars are freely available from multiple sources. Investing.com, Forexfactory.com, and DailyFX all publish comprehensive calendars with impact ratings, consensus forecasts, and historical data. Most major trading platforms including MetaTrader 5 and TradingView also include integrated economic calendars. The official statistical agencies (Bureau of Labor Statistics, Eurostat, ONS) publish release schedules on their own websites.
How far in advance should I prepare for a major data release? For very high impact releases such as NFP and FOMC decisions, reviewing the consensus expectations and your existing positions at least 24 hours in advance is good practice. This gives you time to decide whether to reduce or close positions that would be significantly exposed to the release, rather than making rushed decisions in the minutes immediately before the announcement.
What is "buy the rumor, sell the fact" in economic data trading? This phrase describes a common market behavior where investors purchase a currency in anticipation of a positive economic release, driving the price up before the actual data is published. When the data is released and confirms the expectation (or even exceeds it), the currency sometimes reverses and falls as the traders who bought in anticipation take their profits. This can produce seemingly counterintuitive price action where a currency falls despite a strong data release.
Do all economic indicators affect all currency pairs equally? No. US economic data releases most directly affect USD-denominated pairs (EUR/USD, GBP/USD, USD/JPY). UK data most affects GBP pairs. Eurozone data most affects EUR pairs. However, because the USD is the world's reserve currency and the US economy is the world's largest, major US data releases often produce ripple effects across all currency pairs, even those not directly involving the dollar.
Is it better to trade before or after economic data releases? Most professional traders prefer to wait until after the initial volatility spike following a high-impact data release has settled before entering trades. The first five to fifteen minutes after a major release often feature very wide spreads, unpredictable price spikes, and potential for significant slippage on stop-loss orders. Once the initial reaction settles into a clearer directional move, risk-to-reward ratios on new trades typically improve significantly.
Why do currencies sometimes move opposite to what the data suggests? This counterintuitive behavior occurs for several reasons. Markets may have already priced in a very strong number, so even a moderately good result disappoints relative to the "whisper number" (the informal expectation above the official consensus). Multiple data points released simultaneously may send conflicting signals. Or a strong economic figure may increase recession concerns if it suggests the central bank will tighten more aggressively, which the market views as ultimately negative.
RISK DISCLAIMER: Trading around economic data releases involves heightened risk due to increased volatility and spread widening. This article is for educational purposes only and does not constitute financial advice. Always implement appropriate risk management before holding positions through scheduled high-impact events.