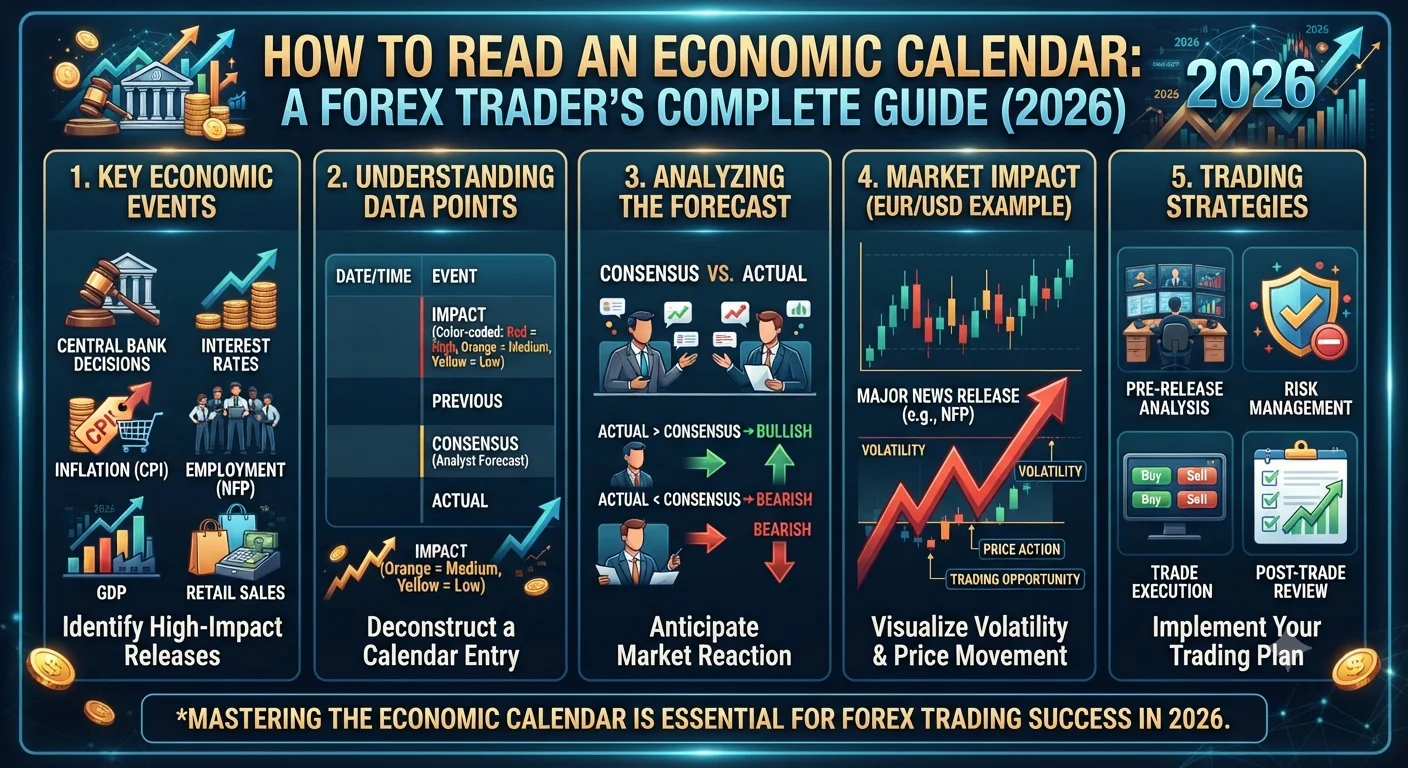
Quick Answer: How Do You Read an Economic Calendar?
An economic calendar displays upcoming economic data releases and events in chronological order, showing the date and time of each release, the currency and country affected, an impact rating (low, medium, or high), the previous figure, the market consensus forecast, and the actual result once announced. Traders read this information to anticipate which currency pairs are likely to experience increased volatility and to prepare their trading approach before, during, and after high-impact releases.
Introduction
- Quick Answer: How Do You Read an Economic Calendar?
- Introduction
- What Is an Economic Calendar and Why Is It Essential?
- Understanding Impact Levels: Low, Medium, and High Impact Events
- Key Sections of an Economic Calendar Explained
- Previous vs Forecast vs Actual Data
- Currency and Country Flags
- Volatility Indicators and Revision Markings
- The 5 Most Market-Moving Events in 2026
- Strategies for Trading Economic Data Releases
- Strategy 1: Pre-News Positioning
- Strategy 2: Post-News Breakout
- Strategy 3: Avoiding Trading Around News
- Key Takeaways
- Frequently Asked Questions
Every Monday morning, the most disciplined forex traders in the world do the same thing before analyzing a single chart or considering a single trade: they open their economic calendar and map out the week ahead.
This is not a ritual. It is a strategic necessity. The forex market does not move in a vacuum. Its biggest daily price swings are almost always tied to specific, scheduled economic data releases and central bank events that are known in advance. A trader who enters a position on Tuesday morning without knowing that the Federal Reserve Chair is speaking on Wednesday afternoon, or that the US Consumer Price Index is being released on Thursday, is operating with a critical blind spot that can produce unexpected and damaging results.
The economic calendar is the tool that closes that blind spot. It provides a complete roadmap of the week's most market-moving events, allowing traders to manage existing positions appropriately, identify opportunities to trade the data releases themselves, and avoid the widened spreads and unpredictable volatility that surround high-impact events when exposure is neither desired nor planned.
This guide teaches you everything you need to know to read, interpret, and act on an economic calendar effectively in 2026, including a detailed breakdown of every calendar element, the five most market-moving event types, and three proven strategies for trading economic data releases.
What Is an Economic Calendar and Why Is It Essential?
An economic calendar is a forward-looking schedule of macroeconomic data releases, central bank meetings, government policy announcements, and other scheduled events that have historically demonstrated the ability to move financial markets. Most economic calendars display information for a rolling two-to-four-week window and are updated continuously as release times are confirmed and actual data becomes available.
The economic calendar matters for three distinct groups of traders:
Active traders use the calendar to identify the specific windows of highest volatility during the trading week, allowing them to be positioned appropriately for data-driven moves or to avoid having open positions exposed to binary event risk they have not specifically analyzed and prepared for.
Swing and position traders holding positions over multiple days or weeks use the calendar to identify upcoming events that might temporarily move price against their thesis, and to decide whether to reduce position size, tighten stops, or simply hold through the event based on their assessment of the likely outcome.
Long-term investors use economic calendar data over time to track the trajectory of key indicators and understand the fundamental environment shaping the medium-term direction of currency pairs they hold positions in.
The economic calendar is not just a reactive tool for traders who want to trade the news. It is a proactive risk management instrument for any trader who wants to understand the event landscape surrounding their open positions.
Understanding Impact Levels: Low, Medium, and High Impact Events
Every event on a professional economic calendar carries an impact rating that estimates its likely market-moving potential. While the specific terminology varies between calendar providers, most use a three-tier system represented by color codes (green, yellow, red) or explicit labels.
Low-impact events are data releases or scheduled announcements that rarely produce significant currency market movements under normal circumstances. Examples include minor manufacturing surveys, secondary regional economic indices, and speeches by lower-ranking central bank officials with limited policy influence. Low-impact events can occasionally produce outsized market reactions if they confirm or contradict an established narrative, but this is the exception rather than the rule.
Medium-impact events include economic data releases and announcements that regularly produce noticeable but typically not extreme market reactions. Examples include Purchasing Managers Index (PMI) surveys, retail sales data, trade balance reports, producer price index releases, and speeches by central bank officials who are not the primary policy decision-makers. These events are worth monitoring and may influence your position management decisions, particularly if the actual result significantly deviates from the consensus forecast.
High-impact events are the category that demands the full attention of every active forex trader. These are the releases and events with a documented history of producing the largest single-session market moves. For USD-denominated pairs, the canonical high-impact events are Non-Farm Payrolls, Consumer Price Index releases, FOMC interest rate decisions and press conferences, and GDP advance estimates. For EUR pairs, ECB Governing Council meetings and Eurozone inflation data carry equivalent weight. For GBP pairs, Bank of England Monetary Policy Committee decisions, UK CPI, and UK employment data are the primary high-impact events.
The impact rating represents the historical average market reaction to each event type. Actual reactions vary based on how significantly the released figure deviates from the consensus forecast and what the broader market context is at the time of release. A high-impact event that produces a result perfectly matching the consensus may generate very little movement. A medium-impact event producing a massive surprise relative to expectations can occasionally produce the largest move of the day.
Key Sections of an Economic Calendar Explained
A comprehensive economic calendar entry contains multiple data fields, each carrying specific information relevant to trading decisions. Understanding each field thoroughly allows you to extract maximum value from the calendar.
Previous vs Forecast vs Actual Data
These three data points are the core analytical content of every economic calendar entry and deserve detailed explanation.
The Previous figure shows the most recently released value for the same indicator. This establishes the baseline from which the current release will be compared. Markets evaluate current data not only against the forecast but also against the trend of previous readings: an improvement from the previous figure is generally bullish for the currency even if it falls short of the forecast, while a deterioration from the previous figure is generally bearish even if it beats the forecast.
The Forecast figure (also called the consensus estimate) represents the median expectation of economists and analysts surveyed before the release. This consensus is compiled by financial data providers including Bloomberg, Reuters, and Trading Economics, typically by polling between 20 and 50 professional economists in the days preceding the release. The forecast is critically important because it represents what is already priced into the market. Markets do not react to absolute data levels; they react to how the actual data compares to what was expected.
The Actual figure is published at the moment of release and triggers the immediate market reaction. The direction and magnitude of the price response depends almost entirely on the deviation of the actual from the forecast. A larger positive deviation (actual significantly better than forecast) produces a stronger bullish currency reaction. A larger negative deviation (actual significantly worse than forecast) produces a stronger bearish reaction. Near-consensus results typically produce muted or no reactions.
Currency and Country Flags
Every calendar entry displays the currency and country associated with the data release, allowing traders to identify immediately which currency pairs will be most directly affected. A US dollar flag on an entry signals that USD-denominated pairs will react. A euro flag signals EUR pairs. This filtering function is particularly useful for traders who focus on specific pairs, as it allows quick identification of relevant events while ignoring releases for currencies they do not trade.
When two events for different currencies occur near the same time, the relative impact on pairs involving both currencies can be complex. For example, if a strong US NFP release coincides with a weak Eurozone PMI, the combined effect on EUR/USD is likely to be strongly bearish on EUR/USD, as both releases point in the same direction. If the signals are mixed (strong US data with strong Eurozone data), the net effect on EUR/USD may be muted or indeterminate.
Volatility Indicators and Revision Markings
Some economic calendars include additional indicators showing the historical average market volatility generated by each event type, expressed in pips. This allows traders to set realistic expectations for potential price movement during specific releases and calibrate position sizing accordingly.
Many calendars also flag revisions: adjustments to previously released figures that are published alongside the current release. Significant revisions to prior period data can sometimes produce as much market reaction as the current period's result, particularly for high-impact releases like NFP, where the prior month's figure is revised simultaneously with the current month's release.
The 5 Most Market-Moving Events in 2026
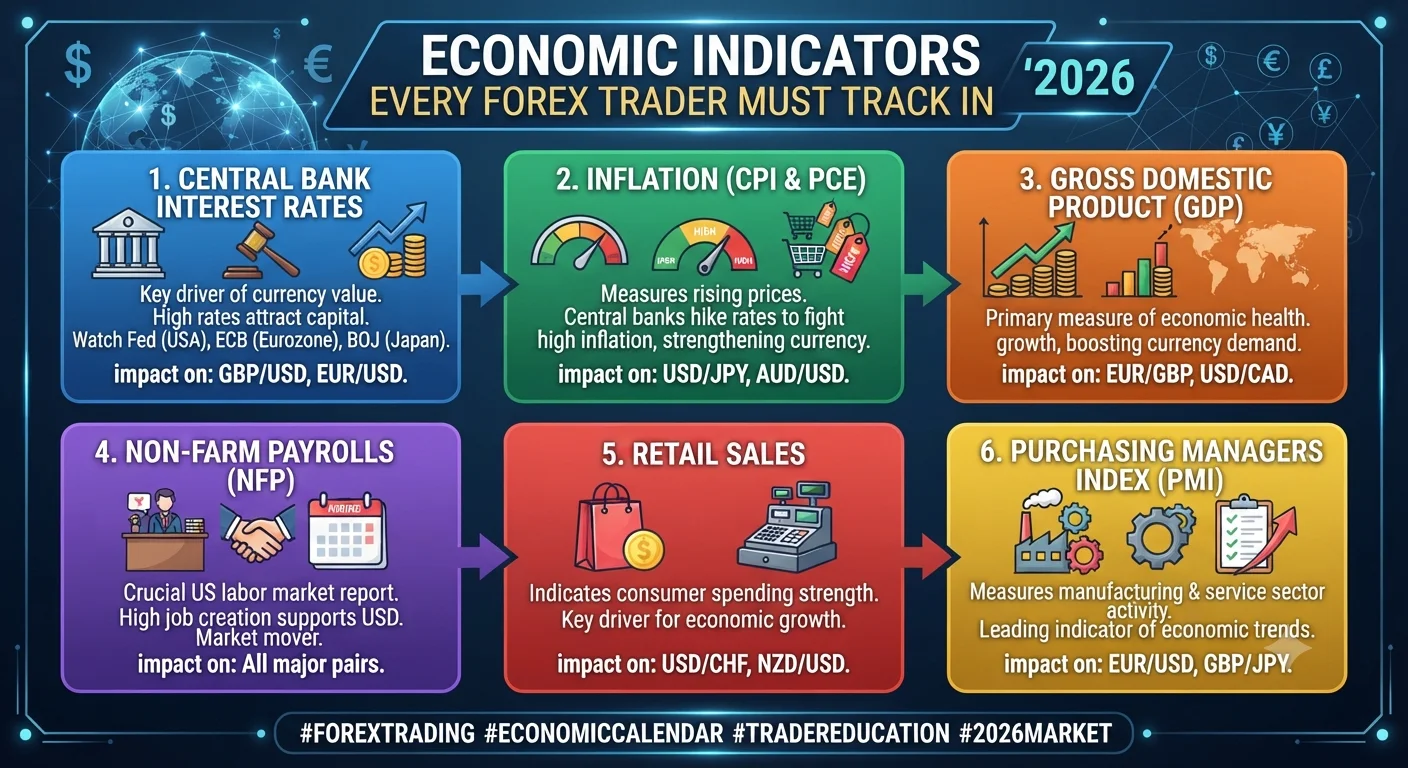
These five event types consistently produce the largest forex market movements and deserve special treatment in any trader's weekly planning process.
Recommended Articles
 ECONOMIC NEWS ANALYSIS
Non-Farm Payrolls (NFP): Released on the first Friday of every month at 8:30 AM Eastern Time by the US Bureau of Labor Statistics. NFP measures the net change in US employment outside agriculture and directly influences Federal Reserve policy expectations. It is universally acknowledged as the single most market-moving scheduled economic data release in the global forex market. EUR/USD, GBP/USD, and USD/JPY routinely move 50 to 150 pips within the first 30 minutes of NFP release.
Consumer Price Index (CPI): Monthly inflation data releases from major economies, particularly the US CPI published mid-month and the Eurozone HICP flash estimate published at month end. Given the centrality of inflation control to most central bank mandates in 2026, CPI releases are among the most consequential scheduled events for monetary policy expectations and currency valuations.
FOMC Interest Rate Decision and Press Conference: Occurring eight times per year, the Federal Reserve's interest rate decision and the subsequent press conference by the Fed Chair are the highest-impact central bank events in the global calendar. The two-hour post-decision trading window, spanning the statement release and the Chair's press conference, frequently produces the largest sustained directional currency moves of any single event in the forex calendar.
GDP Advance Estimate: Published quarterly by major statistical agencies, the advance GDP estimate is the first comprehensive measure of economic growth for the prior quarter and can produce significant market reactions, particularly if it significantly exceeds or falls short of the consensus forecast.
Central Bank Rate Decisions (non-Fed): ECB, BOE, BOJ, and RBA rate decisions are high-impact events for their respective currencies and for cross pairs involving those currencies. The BOJ in particular has produced some of the most dramatic market reactions of any central bank in recent years as its policy normalization process has unfolded.
Strategies for Trading Economic Data Releases
Trading around economic data releases is a specialist discipline that differs meaningfully from trend-following or technical analysis-based trading. Three distinct strategic approaches are used by traders who focus on news events.
Strategy 1: Pre-News Positioning
Pre-news positioning involves analyzing the consensus forecast, the trend of recent data revisions, and the broader market context to form a view on whether the actual release is likely to beat or miss the consensus, then establishing a position before the release in anticipation of that outcome.
The risk of this approach is significant: economic forecasts are uncertain, and a pre-positioned trade can be immediately and severely damaged if the actual data produces the opposite reaction from what was anticipated. Successful pre-news positioning requires both a strong analytical framework for assessing data likelihood and a carefully managed position size that limits the damage of an adverse surprise.
A practical refinement is to enter pre-news positions only when there is a clear recent trend in the data that the forecast may be underestimating: for example, if the previous three NFP releases have all come in above consensus, a trader might assess that there is a higher-than-random probability of another beat and position accordingly.
Strategy 2: Post-News Breakout
The post-news breakout strategy waits for the initial volatility spike following the data release to settle (typically 15 to 30 minutes), then identifies the direction of the established reaction and enters a trade in that direction on a pullback to a key technical level.
This approach avoids the extreme bid-ask spread widening and unpredictable volatility of the first few minutes after a high-impact release while still capturing the directional move that typically develops once the market has absorbed the initial reaction. The premise is that the market's first post-data move often represents the genuine directional consensus, and pullbacks within the first hour of trading following the release offer better risk-to-reward entries than chasing the initial spike.
The key risk is that post-news moves sometimes reverse sharply, particularly in "buy the rumor, sell the fact" scenarios where a strong data print had already been substantially priced in during the days preceding the release.
Strategy 3: Avoiding Trading Around News
The most consistently recommended approach for developing traders is to avoid holding open positions during high-impact news releases and to wait for the post-release environment to stabilize before re-entering the market.
This strategy accepts that news trading is a specialized skill requiring significant experience and that the risks of adverse surprises, spread widening, and unpredictable algorithmic reactions during releases outweigh the opportunities for most retail traders, particularly those in the early stages of their development.
Practical implementation involves reviewing the weekly calendar on Monday morning, noting all high-impact events with their exact release times, and setting a simple rule: no new position entries in the 30 minutes before or the 15 minutes after high-impact releases, and a review of existing positions before each major event to decide whether to close or reduce them based on the binary risk they represent.
Key Takeaways
- The economic calendar is an essential weekly planning tool for every active forex trader, providing a roadmap of scheduled high-impact events that are most likely to drive significant currency price movements.
- The three most important data points in any calendar entry are the Previous figure (establishing the trend baseline), the Forecast figure (representing what is already priced into the market), and the Actual figure (the deviation from which drives the market reaction).
- Impact levels help traders prioritize attention: low-impact events rarely move markets significantly, medium-impact events warrant monitoring, and high-impact events demand active position management decisions before their release.
- The five most consequential events in 2026 are NFP, CPI releases, FOMC decisions and press conferences, GDP advance estimates, and major central bank rate decisions from the ECB, BOE, and BOJ.
- Three strategic approaches to news trading exist: pre-news positioning based on data trend analysis, post-news breakout entries after the initial volatility settles, and the more conservative approach of avoiding open positions during high-impact releases.
- Markets react to the deviation between the actual released figure and the consensus forecast, not to the absolute level of the data. A strong number that matches expectations may produce no reaction, while a modest beat of a significantly underestimated consensus can produce the largest move of the week.
Frequently Asked Questions
Which economic calendar is the most accurate and reliable? Several high-quality economic calendars are freely available. Investing.com and Forexfactory.com are the most widely used among retail forex traders, offering comprehensive event coverage, impact ratings, historical data comparison, and real-time actual figure updates at the moment of release. The official statistical agency websites for each country (Bureau of Labor Statistics, Eurostat, Office for National Statistics) provide the authoritative release schedules and are worth bookmarking for exact timing confirmation. MetaTrader 5 and TradingView both offer built-in calendars with varying levels of detail.
How far in advance are economic calendar events known? Most major scheduled economic releases are known well in advance. Statistical agencies publish release calendars at the beginning of each year showing the scheduled dates for all their regular publications. Central bank meeting calendars are also published annually. The exact release times are typically confirmed in the days immediately preceding each release. The only significant variable is the actual content of the release, which is embargoed until the scheduled moment of publication.
What is a "whisper number" in economic data trading? A whisper number is an informal expectation that circulates among sophisticated traders and analysts that differs from the published consensus forecast. It represents the assessment of those who follow the highest-frequency and most current data signals available, including real-time indicators, satellite data, and quantitative models, that the actual result will be higher or lower than the survey-based consensus. When the whisper number differs significantly from the official consensus, even a figure that beats the published consensus may produce a weaker-than-expected bullish reaction if it still falls short of the whisper.
Should I close all positions before high-impact news events? Whether to close positions before high-impact events depends on your trading time frame, your risk tolerance, and the relationship between the event and your trade thesis. If you are a short-term trader whose position has a tight stop-loss that could easily be triggered by the volatility spike, closing before the release and re-entering afterward is prudent. If you are a swing trader with a wide stop-loss based on daily chart structure and the event is not expected to fundamentally alter the medium-term picture, holding through the event may be appropriate with a reduced position size. There is no universal right answer; the decision should be made deliberately based on these factors rather than by default.
What happens to spreads during high-impact news releases? Spreads on affected currency pairs typically widen significantly in the minutes immediately before and during high-impact news releases as liquidity providers withdraw from the market to avoid the risk of being adversely selected by traders with faster information access. For EUR/USD, which normally carries a spread of 0.5 to 1.0 pip with competitive brokers, the spread can widen to 5 to 20 pips or more during major releases like NFP. This widening means that stop-losses placed close to current price may be triggered at prices significantly worse than the specified level. Be aware of this risk when holding positions through high-impact events.
RISK DISCLAIMER: Trading around economic data releases involves heightened risk due to increased volatility and spread widening. This article is for educational purposes only and does not constitute financial advice. Always implement appropriate risk management when trading around scheduled economic events.