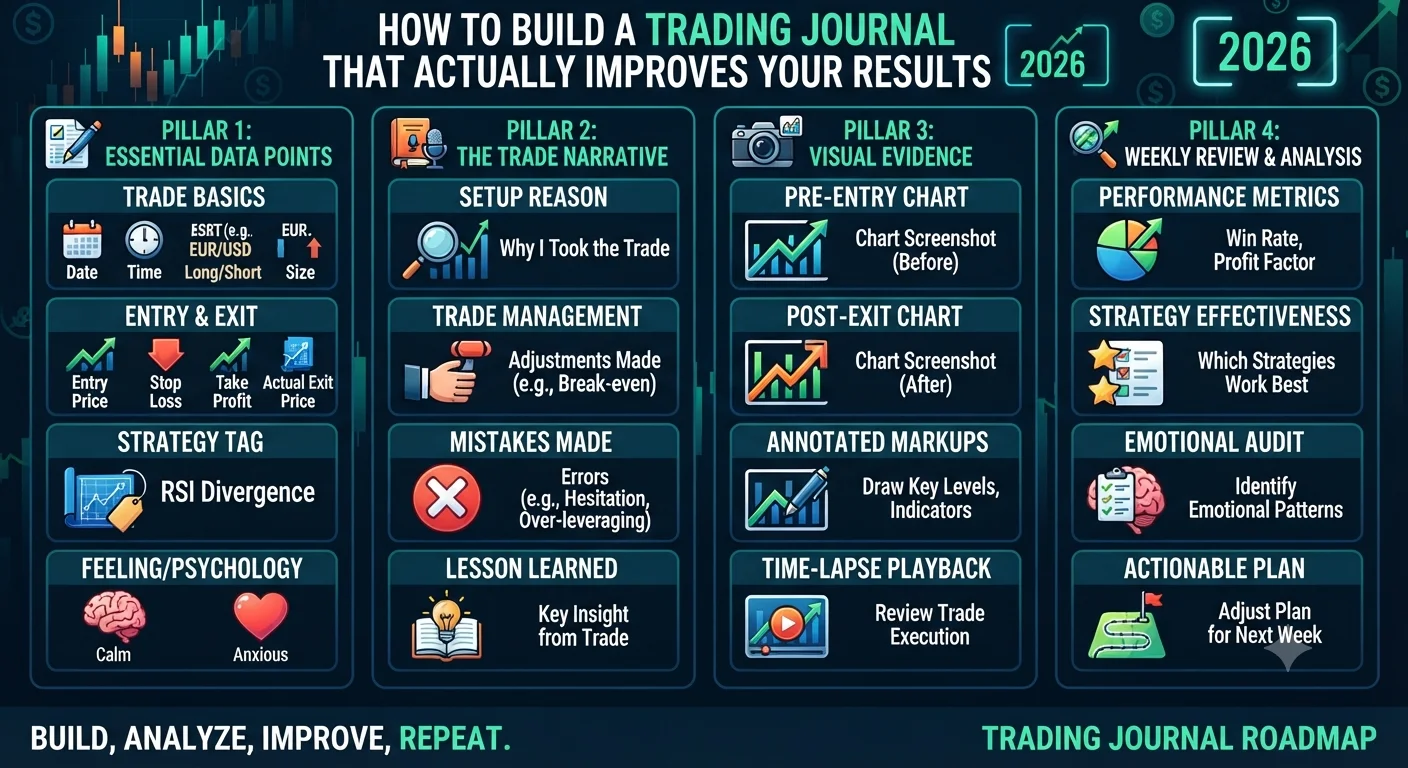
Quick Answer: What Is a Trading Journal and Why Does Every Serious Trader Need One?
A trading journal is a detailed record of every trade you make, capturing not just the financial data (entry price, exit price, profit or loss) but also the reasoning behind each decision, your emotional state during execution, and a post-trade review of what you did well and what you should have done differently. It transforms your trading history from a raw sequence of outcomes into actionable intelligence about your actual behavior in the market, revealing patterns that are completely invisible to a trader who relies only on memory and gut feel.
Introduction
- Quick Answer: What Is a Trading Journal and Why Does Every Serious Trader Need One?
- Introduction
- Why Every Serious Trader Keeps a Journal
- What to Record in Your Trading Journal
- Phase 1: Pre-Trade Entry
- Phase 2: During the Trade
- Phase 3: Post-Trade Review
- How to Analyze Your Journal Data for Performance Patterns
- Digital vs Paper Trading Journals: Pros and Cons
- Free and Paid Trading Journal Tools in 2026
- Building the Journal Habit: Making It Stick
- Key Takeaways
- Frequently Asked Questions
Every professional in a performance-driven field keeps detailed records. Surgeons document case notes. Professional athletes review game film. Elite chess players study their games move by move. In each case, the purpose is identical: to create an objective record of decisions and outcomes that can be analyzed without the distortions of memory and ego, so that genuine improvement can be made systematically rather than through vague intention.
Trading is no different. The difference between a trader who improves steadily over one to two years and one who makes the same mistakes repeatedly for a decade is, in the majority of cases, the presence or absence of a disciplined journaling practice.
This is not a marginal benefit. A 2020 study examining retail trader behavior found that traders who maintained detailed performance records showed significantly faster rates of improvement in their key performance metrics than those who did not, because they could identify and address specific behavioral patterns rather than simply resolving to "trade better." The journal does not teach you what the right trade looks like. It teaches you about yourself as a decision-maker, which is what ultimately determines whether your edge translates into consistent profits.
This guide shows you exactly what to include in a trading journal, how to analyze the data it produces, how to choose between digital and paper formats, and which tools in 2026 make the process as frictionless as possible.
Why Every Serious Trader Keeps a Journal
The case for journaling rests on three separate but complementary pillars: performance measurement, pattern recognition, and psychological accountability.
Performance measurement is the most straightforward function. Without precise records, a trader cannot answer basic questions about their own results with any accuracy. What is my actual win rate? What is my average risk-to-reward ratio realized (not just targeted)? Which currency pairs produce my best results? Which time frames am I most profitable on? Which days of the week are my worst? These are not rhetorical questions. They are the metrics that determine whether a strategy has positive expectancy over a meaningful sample size, and they are impossible to calculate reliably from memory.
Pattern recognition is where the journal provides its deepest insight. Over hundreds of trades, patterns emerge that reveal the specific conditions under which a trader performs well and those under which they consistently underperform. You may discover that your best trades are entered during the London session on EUR/USD using a specific setup, while your worst trades cluster around news events where you deviate from your plan. You may find that your average winner is being cut short at 1.5 times risk when your plan targets 2 times risk, a systematic behavior that is significantly reducing your expected value. These patterns cannot be seen from individual trade memory. They are statistical phenomena that only become visible across large samples of properly recorded data.
Psychological accountability is the function most often overlooked in discussions of trading journals but arguably the most valuable for developing traders. When you know that every trade decision will be written down and reviewed, including the emotional state that influenced it and any deviations from your plan, the act of making a poor decision becomes more uncomfortable. The journal creates a record you must answer to, and that accountability structure provides a form of external discipline when internal willpower alone is insufficient.
What to Record in Your Trading Journal
A complete trading journal entry captures information in three phases: before the trade, during the trade, and after the trade is closed. Each phase serves a different analytical purpose.
Phase 1: Pre-Trade Entry
Before entering any position, record the following:
Date and Time: Include the exact time of entry. This allows you to identify which trading sessions and times of day produce your best results.
Currency Pair or Instrument: The instrument being traded. Over time you will identify which instruments align best with your analytical strengths.
Time Frame: The primary time frame on which you identified the setup and the higher time frame used for directional context.
Setup Type: A name or code for the specific pattern or signal that triggered the trade. For example: "Support Bounce," "Breakout Retest," "Trend Continuation," or "News Fade." Categorizing setups allows you to compare performance across different pattern types.
Trade Direction: Long (buying) or short (selling).
Entry Price: The exact price at which the position was opened.
Stop-Loss Price: The exact price at which your stop-loss order is placed. Not a pip distance but the actual price level, referenced to the market structure feature that defines your trade invalidation point.
Take-Profit Target: The price at which you plan to close the trade for profit, or a description of your trailing stop methodology if you are managing the exit dynamically.
Risk Amount in Dollars: The exact dollar amount at risk if the stop-loss is hit, calculated from your position size and stop-loss distance. This should equal 1 to 2 percent of your account balance.
Risk-to-Reward Ratio: The ratio of potential profit to potential loss based on your planned exit targets.
Trade Rationale: A written description in two to five sentences of why you are taking this trade. What is the setup? What is the market context (trend direction, key levels, economic calendar)? What is the thesis? Writing this down forces you to articulate your reasoning clearly before committing capital, which filters out trades that "feel right" but lack a coherent analytical foundation.
Screenshot of the Chart: A screenshot of the chart at the time of entry, with your analysis marked up (entry level, stop-loss, target, key levels). This is the single most valuable element in the journal because it preserves exactly what the market looked like when you made the decision, which memory will distort significantly over time.
Phase 2: During the Trade
For shorter-term trades, mid-trade journaling may not be practical. For swing trades held over multiple days, recording key developments is valuable:
Notable price behavior: Did price approach your stop-loss before reversing? Did it hit your target cleanly? Were there any major news events during the hold period?
Any adjustments made: If you moved your stop-loss, adjusted your target, or partially closed the position, record what you did, why you did it, and whether it was in accordance with your trading plan or a deviation from it.
Emotional observations: Any significant emotional experiences during the trade hold period: strong anxiety near the stop-loss, temptation to close early, impulse to add to the position.
Phase 3: Post-Trade Review
This is the most analytically rich phase and the one most often neglected. After every trade is closed, regardless of outcome, record the following:
Exit Price: The actual price at which the position was closed.
Actual Profit or Loss in Dollars and Pips: The precise financial result.
Outcome vs Plan: Did you follow your plan exactly? If you deviated, describe specifically what you did differently and why.
Chart Screenshot at Exit: A second screenshot showing the full trade from entry to exit with the actual outcome visible on the chart.
Grade: Assign the trade a letter grade (A, B, C, D) based on execution quality, not outcome. An A-grade trade is one where you followed every element of your plan flawlessly. A losing trade can receive an A grade if the setup was valid and the execution was correct. A winning trade can receive a C or D grade if it was a deviation from your plan that happened to work out. This grading system prevents the dangerous pattern of learning the wrong lessons from lucky wins and discarding valid strategies after unavoidable losses.
Lessons and Observations: Two to three sentences capturing the most important insight from this trade. What did the market teach you? What would you do differently? What did you do particularly well?
How to Analyze Your Journal Data for Performance Patterns
The raw journal entries are the raw material. The analysis is where the improvement actually happens. Set a regular weekly review session of 30 to 45 minutes during which you examine the data accumulated during the week.
The key metrics to track and review are:
Win Rate: The percentage of trades that close profitably. Track this overall and separately for each setup type, time frame, currency pair, and session. A win rate significantly higher in one category than another points directly to where you should focus your trading attention.
Average Risk-to-Reward Realized: Compare this to your planned ratio. If you consistently target 1:2 but your average realized ratio is 1:1.2 because you close winners early, this single observation identifies a specific behavior change that would dramatically improve your results without any change to your entry methodology.
Recommended Articles
 TRADING PSYCHOLOGY MINDSET
Expectancy: This is the most comprehensive single performance metric. Expectancy equals (Win Rate x Average Win) minus (Loss Rate x Average Loss), expressed in dollars per trade. A positive expectancy means your strategy produces profit over a sufficient sample size. A negative expectancy means it does not, regardless of any individual winning trades.
Worst Performing Days and Sessions: If your journal data shows consistently poor results on Fridays or during the Asian session, you have evidence to consider not trading those periods.
Grade Distribution: What percentage of your trades receive A grades? If you are executing only 40 percent of trades with full plan adherence, you are not actually testing your strategy. You are testing a hybrid of your strategy plus various emotional deviations, which makes it impossible to evaluate whether the underlying strategy has edge.
Deviation Patterns: When you review your D-graded trades, look for common features. Do you most often deviate when you have already had two losses in a row? Do you deviate more during high-volatility news periods? Do you deviate on certain currency pairs but not others? Each pattern reveals a specific psychological vulnerability that can be addressed with a targeted procedural change.
Digital vs Paper Trading Journals: Pros and Cons
Both formats have genuine advantages, and the best choice depends on your personal working style and the trading environment you use.
Paper journals are completely distraction-free. Writing by hand has been shown in educational research to improve information retention and reflection compared to typing, and a paper journal cannot send you notifications or tempt you to check another browser tab. The limitation is that paper records cannot be sorted, filtered, or analyzed statistically. Identifying patterns across hundreds of trades requires manually tabulating data, which is time-consuming and error-prone.
Spreadsheet-based journals (using Microsoft Excel or Google Sheets) provide the best balance of control and analytical power for most traders. You design the exact fields you want to capture, you can apply filters and sorting to identify patterns instantly, you can build charts and graphs that visualize your performance metrics over time, and spreadsheets are accessible from any device. The trade-off is the time investment in building the initial template, though many free templates specifically designed for trading journals are available online.
Dedicated trading journal software offers purpose-built interfaces for trade logging with automated trade import from broker platforms (eliminating manual data entry), automatic performance statistics, equity curve visualization, and setup-specific analytics. Well-regarded options as of 2026 include Edgewonk, Tradervue, and TraderSync, each offering free and paid tiers with varying levels of functionality.
Screenshot organization is an important component of any digital journal. A simple folder structure organized by year, month, and date makes it easy to locate chart screenshots for any historical trade. Cloud storage ensures these records survive hardware changes and are accessible from multiple devices.
Free and Paid Trading Journal Tools in 2026
| Tool | Type | Key Features | Pricing |
|---|---|---|---|
| Google Sheets | Spreadsheet | Fully customizable, free, cloud-based | Free |
| Microsoft Excel | Spreadsheet | Powerful analytics, widely available | Included in Microsoft 365 |
| Edgewonk | Dedicated Software | Behavioral tagging, habit tracking, simulator | Paid (one-time fee) |
| Tradervue | Dedicated Software | Broker import, detailed statistics, sharing | Free and paid tiers |
| TraderSync | Dedicated Software | AI-powered insights, mobile app, broker sync | Free and paid tiers |
| Notion | Note-taking/Database | Flexible structure, chart embeds, templates | Free and paid tiers |
For beginners, starting with a Google Sheets or Excel-based journal built around the fields described in this guide is the most practical approach. It costs nothing, teaches you which metrics matter most to your specific style of trading, and produces all the analytical capability you need at the early stages of your development. Upgrading to dedicated software becomes worthwhile when the volume and complexity of your trading data grows beyond what a spreadsheet manages comfortably.
Building the Journal Habit: Making It Stick
The most sophisticated journal structure in the world produces zero value if it is not maintained consistently. Building the journaling habit requires treating it as a non-negotiable part of the trading process rather than an optional enhancement.
The most effective approach is to make post-trade journal entries immediately after closing each trade while the details are fresh, rather than attempting to reconstruct multiple trades from memory at the end of the day. For traders who use a pre-trade entry system (recording the setup before entering), the habit of opening the journal alongside the trading platform before placing any order creates the right sequence.
Setting a fixed weekly review time, such as Sunday evening before the trading week begins, creates a regular rhythm for the analytical work that transforms individual entries into performance-improving insights. During this review, identify the single most important behavioral pattern revealed by the week's data and commit to one specific adjustment for the following week. Small, targeted adjustments applied consistently produce far more improvement than sweeping resolutions to "trade better overall."
Key Takeaways
- A trading journal is the most powerful tool available for systematically improving trading performance because it creates an objective record that reveals behavioral patterns invisible to memory and intuition.
- A complete journal entry captures pre-trade reasoning, setup details, risk parameters, chart screenshots, emotional state, and a post-trade grade based on execution quality rather than outcome.
- The most valuable performance metrics to track are win rate by setup type, average realized risk-to-reward ratio, expectancy per trade, and grade distribution across all trades.
- Grading trades on execution quality independently of financial outcome teaches the correct lessons from both winners and losers, which is essential for improving the behaviors that actually determine long-term results.
- Weekly analytical reviews of accumulated journal data, looking specifically for behavioral patterns in your deviation trades, translate raw records into actionable improvements.
- Consistency in maintaining the journal matters more than the sophistication of the tool used. A simple spreadsheet maintained daily produces more value than an advanced software solution that is updated sporadically.
Frequently Asked Questions
How long should I keep my trading journal entries? Indefinitely. Your historical trading records become more valuable over time, not less, because they allow you to measure your improvement across longer periods and to revisit how you thought about the market during earlier stages of your development. Storage is essentially free for digital records, so there is no reason to delete historical entries. Many experienced traders find it enormously instructive to review their journal entries from their first year of trading after several years of development.
Do professional traders keep trading journals? Yes. The trading journal practice is standard among professional fund managers, proprietary trading firms, and serious independent traders. Many prop firms require their traders to maintain detailed journals as a condition of employment, specifically because the firms have found that it improves trader performance and accountability. The intensity of the journal process varies by individual, but the core practice of detailed record-keeping and regular performance review is essentially universal among long-term professional traders.
What should I do if my journal reveals a clearly negative expectancy in my strategy? A negative expectancy revealed by journal analysis is valuable information, not a reason for discouragement. It means the record-keeping is working exactly as intended. The next step is to examine which specific elements of your trading are driving the negative expectancy: are your losses too large relative to your wins? Is your win rate too low for your risk-to-reward ratio? Are there specific setups or conditions that are consistently losing while others are breaking even or winning? This granular analysis points directly to what needs to be adjusted, whether that is the strategy itself, the execution, or the conditions under which you take trades.
How many trades do I need in my journal before the data becomes meaningful? A minimum of 50 to 100 trades in similar market conditions is generally considered the threshold below which statistical conclusions are unreliable. Below this sample size, short-term variance in outcomes (both good and bad luck) dominates the results and can produce misleading conclusions about the underlying strategy's edge. Behavioral patterns in journal data (such as consistently deviating from the plan in specific circumstances) can often be identified with smaller samples because they are qualitative observations rather than statistical measurements.
Should I journal demo trades the same way I journal live trades? Yes, and doing so from the very beginning of your demo trading builds the journaling habit before real money is at stake, making it feel automatic and natural by the time you transition to live trading. Demo journal entries that include the emotional state section are less useful than live trade entries because the absence of real financial risk eliminates most of the psychological dynamics that journaling is designed to capture. However, demo journaling for setup documentation, plan adherence grading, and strategy performance tracking is fully valuable.
RISK DISCLAIMER: A trading journal is a performance improvement tool and does not guarantee profitable trading outcomes. Trading involves substantial risk of loss. This article is for educational purposes only and does not constitute financial advice.